Cybersecurity Data Fabric: What on earth is security data fabric?

Understand what a Security Data Fabric is, and why an enterprise security team needs one to achieve better security while reducing SIEM and storage costs

March 12, 2024

What on earth is security data fabric, and why do we suddenly need one?

Every time I am at a security conference, a new buzzword is all over most vendors’ signage, one year it was UEBA (User Entity and Behavioral Analytics), next EDR (Endpoint Detection and Response), then XDR (Extended Detection and Response), then it was (ASM) Attack Surface Management. Some of these are truly new and valuable capabilities, some of these are rebranding of an existing capability. Some vendors have something to do with the new capability (i.e., buzzword), and some are just hoping to ride the wave of the hype. This year, we will probably hear a lot on GenAI and cybersecurity, and on the security data fabric. Let me tackle the latter in this article, with another article to follow soon on GenAI and Cybersecurity.

Problem Statement:

Many organizations are dealing with an explosion of security logs directed to the SIEM and other security monitoring systems, Terabytes of data every day!

  • How to better manage the growing cost of the security log data collection?
  • Do you know if all of this data clogging your SIEM storage has high security value?
  • Are you collecting the most relevant security data?

To illustrate, here is an example of windows security events and a view on what elements have high security value compared to the total volume typically collected:

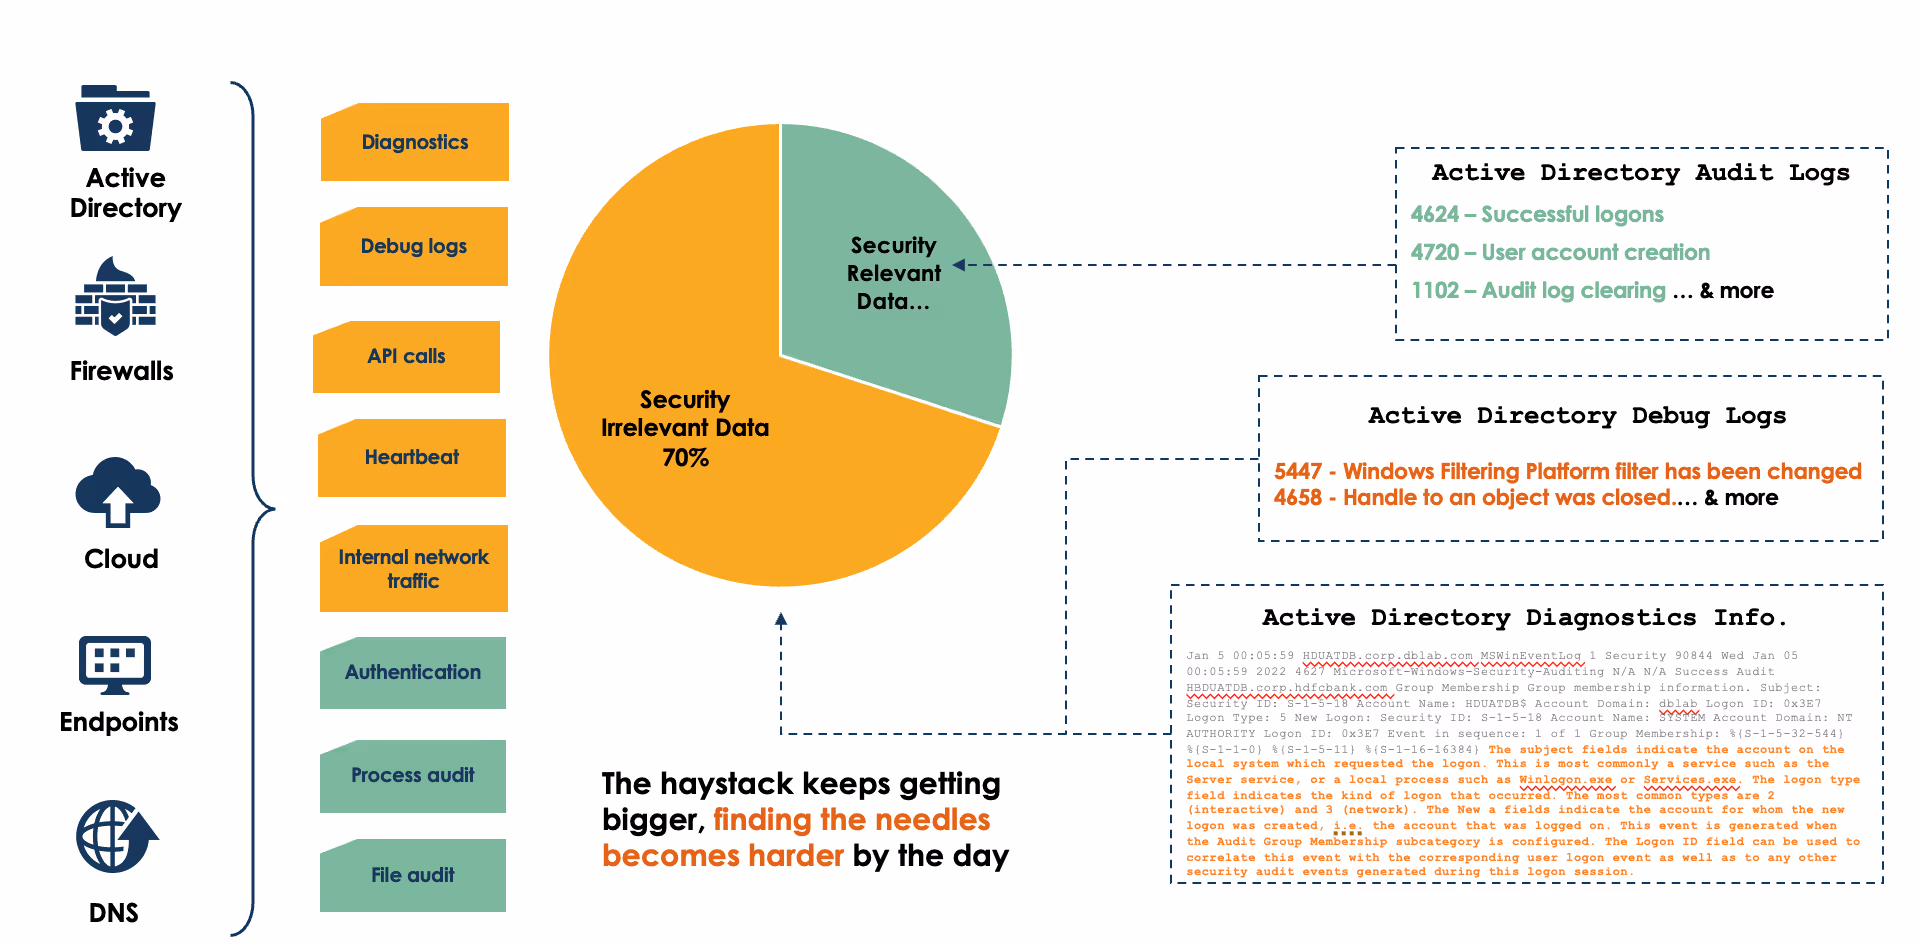
  • Do you have genuine visibility into potential security log data duplication and underlying inconsistencies? Is your system able to identify missing security logs and security log schema draft fast enough for your SOC to avoid missing something relevant?
  • As SIEM and security analytics capabilities evolve, how do to best decouple security log integration from SIEM and other threat detection platforms to allow not only easier migration to lasted technology but provide cost-effective and seamless access of this security data for threat hunting and other user groups?
  • Major Next Gen SIEMs operate on a consumption-based model expecting end users to break down queries by data source and/or narrowed time range; which increases the total # of queries executed and increases your cost significantly!! Major Next-Gen SIEMs operate on a consumption-based model expecting end users to break down queries by data source and/or narrowed time range; which increases the total # of queries executed and increases your cost significantly!!

As security practitioners, we either accepted these issues as the cost of running our SOC, handled some of these issues manually, or hoped that either the cloud and/or SIEM vendors would one day have a better approach to deal with these issues, to no avail. This is why you need a security data fabric.

What is a Security Data Fabric (SDF)?

A data fabric is a solution that connects, integrates, and governs data across different systems and applications. It uses artificial intelligence and metadata automation to create flexible and reusable data pipelines and services. For clarity, a data fabric is simply a set of capabilities that allows you a lot more control of your data end to end, on how this data is ingested and where to forward it and stores it, in service of your business end goals, compared to just collecting and hoarding a heap of data in an expensive data lake, and hoping one day some use will come of it. The security data fabric is meant to tightly couple these principles with deep security expertise and the use of artificial intelligence to allow mastery of your security data and optimize your security monitoring investments and enable enhanced threat detection.

They key outcome of a security data fabric is to allow security teams to focus on their core function (i.e., threat detection) instead of spending countless hours tinkering with data engineering tasks, which means automation, seamless integration and minimal overhead on ongoing operations.

Components of a Security Data Fabric (SDF):
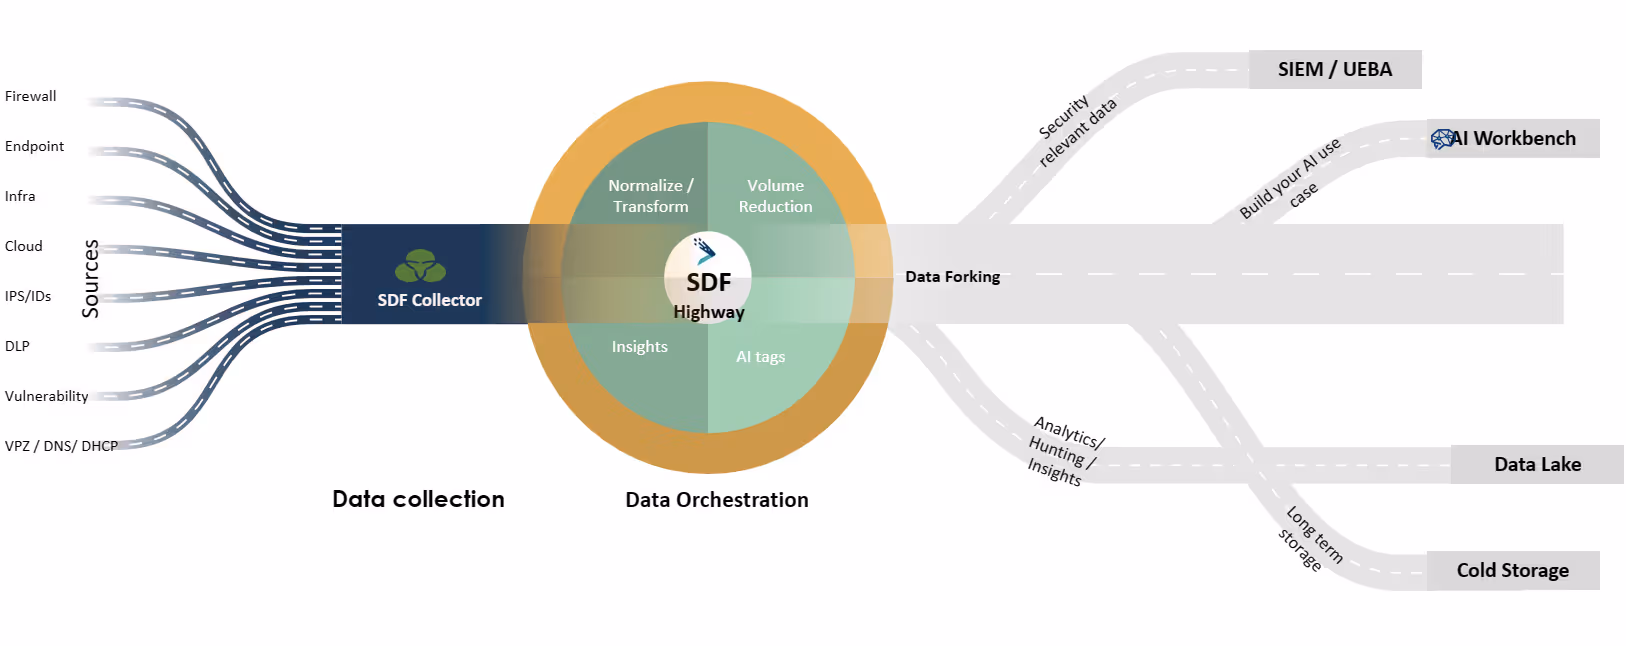
Smart Collection:

This is meant to decouple the collection of the security data logs from the SIEM/UEBA vendor you are using. This allows the ability to send the relevant security data to the SIEM/UEBA, sending a copy to a security data lake to create additional AI-enabled threat detection use cases (i.e., AI workbench) or to perform threat hunting, and send compliance-related logs to cold storage.

    Why important?         
  1. Minimize vendor lock-in and allow your system to leverage this data in various environments and formats, without needing to pay multiple times to use your own security data outside of the SIEM - particularly for requirements such as threat hunting and the creation of advanced threat-detection use cases using AI.
  1. Eliminate data loss with traditional SIEM log forwarders, syslog relay servers.
  1. Eliminate custom code/scripts for data collection.
  1. Reduced data transfer between cloud environments, especially in the case of having a hybrid cloud environment.

Security Data Orchestration:

This is where the security expertise in the security data fabric becomes VERY important. The security data orchestration includes the following elements:

  • Normalize, Parse, and Transform: Apply AI and security expertise for seamless normalization, parsing, and transforming of security data into the format you need for ingestion into your SIEM/UEBA tool, such as OCSF, CEF, CIM, or to a security data lake, or other data storage solutions.
  • Data Forking: Again, applying AI and security expertise to identify which security logs have the right fields and attributes that have threat detection value and should be sent to the SIEM, and which other logs should be sent straight to cold storage for compliance purposes, as an example.
  • Data Lineage and Data Observability: These are well-established capabilities in data management tools. We are applying it here to security data, so we no longer need to wonder if the threat detection rule is not firing because the log source is dead/MIA or because there are no hits. Existing collectors do not always give you visibility for individual log sources (at the level of the Individual device and log attribute/telemetry). This capability solves this challenge.
  • Data Quality: Ability to monitor and alert on schema drift and track the consistency, completeness, reliability, and relevance of the security data collected, stored, and used
  • Data Enrichment: This is where you start getting exciting value. The security data fabric uses its visibility to all your security data with insights using advanced AI such as:

    • Correlate with threat intel showing new CVEs or IoCs impacting your assets, here is how it looks in the MITRE Att&ck kill chain and provides a historical view of the potential presence of these indicators in your environment.
    • Recommendations on new threat detection use cases to apply based on your threat profile.
   Why important?
  1. Automation: At face value, existing tools promise some of these capabilities, but they usually need a massive amount of manual effort and deep security expertise to implement. This allows the SOC team to focus on their core function (i.e., threat detection) instead of spending countless hours tinkering with data engineering tasks.
  2. Volume Reduction: This is the most obvious value of using a security data fabric. You can reduce 30-50% of the data volume being sent to your SIEM by using a security-intelligent data fabric, as it will only forward data that has security value to your SIEM and send the rest to cheaper data storage. Yes, you read this correctly, 30-50% volume reduction! Imagine the cost savings and how much new useful security data you can start sending to your SIEM for enhanced threat detection.
  3. Enhanced Threat Detection: An SDF will enable the threat-hunting team to run queries more effectively and cheaply by giving them the ability to access a separate data lake, you get full control of your security data, and ongoing enrichments in how to improve your threat detection capabilities. Isn’t this what a security solution is about at the end of the day?
Ready to unlock full potential of your data?
Share

See related articles

It started with a routine software update.

CrowdStrike pushed a version update overnight. Standard rollout. The release notes mentioned "enhanced detection telemetry"—nothing that warranted a second look.

But buried in the update was a quiet structural change: a field that had always been an integer was now a string. One field. One type change.

At 2:47 AM, the SOC lost visibility into their entire EDR fleet.

No alert fired. The pipeline parser hit the mismatch and stopped. Events kept arriving, thousands of them, but nothing made it through to the SIEM. By morning, 6 hours of endpoint telemetry was gone. Two open investigations had lost critical context.

The incident wasn't caused by a cyberattack. It was a vendor changing a field type without telling anyone.

This is schema drift; one of the most underestimated operational threats to sustained OCSF compliance.

Why OCSF And Why Drift Breaks It

The Open Cybersecurity Schema Framework solves a fundamental problem: vendor log formats are incompatible by design. OCSF provides a unified schema that maps disparate sources to consistent field names and types, enabling detection rules to work across all sources and investigations to query unified fields instead of vendor-specific ones.

The operational impact is significant, detection rules become source-agnostic, investigations query unified fields instead of vendor-specific ones, and query complexity drops dramatically when you're not accounting for schema variations across dozens of sources.

The promise is real. Sustaining it requires addressing multiple operational challenges: manual mapping effort, incomplete field coverage, version management, and schema drift.

The OCSF Compliance Erosion Problem

Organizations adopting OCSF face a specific operational reality: you can achieve 99% OCSF compliance on launch day and watch it erode to 85% within months—not because the OCSF standard changed, but because your upstream source schemas did.

Here's the cascade:

  1. Vendor changes upstream schema → Field src_ip becomes source_ip_address
  1. Parser breaks → Field extraction fails silently
  1. OCSF mapping fails → Events arrive with null values in critical OCSF fields
  1. Detection rules miss events → OCSF fields expected by correlation logic are empty
  1. Analysts investigate blind → Can't query unified field names across sources

By the time your team notices, you've been running with degraded OCSF compliance for weeks. The silent failure is the dangerous part. Broken OCSF mappings don't throw errors visible to operators. They just produce incomplete normalized events with critical fields unpopulated.

Industry practitioners recommend monitoring OCSF pipeline health through metrics including ingestion volume, mapping failure rate, dropped events, invalid records, and schema drift. Organizations report that production incidents increase 27% for every percentage point rise in schema drift frequency. At enterprise scale, that's not a metric; it's an operational crisis waiting for a date.

What Drift Looks Like in OCSF Pipelines

Scenario 1: Type Mismatch
Your firewall vendor changes a timestamp from Unix epoch (integer) to ISO 8601 (string). The OCSF mapper expects time as an integer. It receives a string. The field maps as null. Every time-based correlation for that source breaks.

Scenario 2: Field Removal
An identity provider deprecates user_principal_name without warning. The parser fails silently. OCSF's actor.user field stays empty. Identity-based detections stop working.

Scenario 3: The Rename
A SaaS vendor renames event_type to activity_type in their API v3. Your pipeline still looks for event_type. OCSF's activity_id field remains unpopulated. Detection rules filtering by activity type miss everything from that source.

None of these scenarios are hypothetical. They happen every week in production SOC pipelines managing OCSF normalization at scale.

Why Manual OCSF Maintenance Doesn't Scale

Manual remediation takes 2-4 weeks per source, from discovery to parser development to OCSF mapping to testing to deployment. Meanwhile, OCSF compliance degrades, detection coverage has gaps, and investigations lack normalized context.

The scale is the problem. Every source drifts on its own schedule — vendor releases, firmware updates, API changes, and deprecations. At 1000+ sources, manual OCSF maintenance becomes structurally impossible. Your engineering team isn't slow, they're outnumbered by the pace of upstream change.

Automated OCSF Compliance: Detection and Remediation

Sustained OCSF compliance at enterprise scale requires automation at two levels: detecting drift before it breaks normalization, and remediating it without manual parser development.

Real-Time Drift Detection and Health Monitoring

Effective OCSF compliance management starts with continuous health checks at the pipeline layer:

  • Baseline comparison → Every source has an expected structure. Incoming events are validated in real-time before OCSF mapping occurs.
  • Automated deviation alerts → New fields and type mismatches trigger alerts with automated remediation already prepared; operators approve the fix rather than building it from scratch.
  • Mapping failure rate tracking → Monitor what percentage of events fail OCSF mapping. Sudden spikes indicate upstream schema changes.
  • Incomplete mapping detection → Flag when expected OCSF fields remain unpopulated across events from a source.
  • Silence detection → When an expected source stops sending data entirely, the pipeline flags it before analysts notice gaps.

The key insight: detect drift where it happens, not where it breaks OCSF mappings downstream.

Databahn's agentic AI implements this detection layer automatically, continuously monitoring data health, fixing schema consistency, and tracking telemetry health across the pipeline. When a firewall vendor pushes an update at 11:43 PM that changes a timestamp format, the system flags the deviation, quarantines affected events, and prepares remediation before the morning shift arrives.

AI-Powered Parser and OCSF Mapper Generation

Manual parser creation doesn't scale. AI-assisted generation changes the timeline:

Traditional workflow:

  • Vendor update → Engineering backlog → Manual parser → Manual OCSF mapping → Testing → Deploy
  • Timeline: weeks to months

AI-powered workflow:

  • Drift detected → AI analyzes structure → Generates parser and OCSF mapper → Engineer approves → Deploys
  • Timeline: hours to days

Cruz AI handles this generation automatically, analyzing new log structures, producing candidate parsers and OCSF mappers for operator review, and turning weeks of development into approval workflows measured in minutes.

Teams using AI-assisted parser generation have reported significantly faster development cycles, fewer OCSF schema-related incidents reaching production, and normalization accuracy sustained above 99%.

Production Architecture for OCSF Compliance

Edge collection and adaptive routing:
Databahn's Smart Edge collectors capture telemetry at the source with built-in schema validation. When upstream formats change, adaptive routing ensures data keeps flowing; rerouting or buffering automatically to prevent silent data loss that degrades OCSF compliance.

Self-healing pipelines:
According to the SACR 2025 Security Data Pipeline Market Guide, self-healing capabilities are emerging as critical infrastructure. Databahn's agentic AI automatically detects and repairs schema drift, maintaining OCSF field population as source formats evolve.

Continuous health monitoring:
Databahn’s Highway provides complete lineage tracking — source, parser, transform, OCSF mapping, and destination. Built-in monitoring tracks mapping failure rates, schema drift alerts, and incomplete field population, surfacing OCSF compliance degradation before it impacts detection quality.

Quarantine and autonomous remediation:
When incoming data can't be confidently parsed and mapped to OCSF, the system quarantines those events rather than dropping them. Agentic AI attempts automated remediation while operators are alerted to review, ensuring no telemetry is lost.

The Path Forward

OCSF compliance isn't a problem you solve once. It's the continuous operational reality of managing normalized security telemetry at enterprise scale, and schema drift is one of the primary forces working against that compliance.

The organizations maintaining 99% OCSF compliance at scale aren't the ones with bigger engineering teams. They're the ones who automated schema drift detection, implemented continuous health monitoring, and deployed AI-powered parser generation, freeing their engineers to focus on threat detection and security outcomes instead of parser maintenance.

Your pipeline either adapts at the pace of change, or your OCSF compliance degrades at the pace of change.

Every week your team spends manually updating parsers is a week your competitors spend building better detections. The SOCs that solved schema drift didn't do it by hiring more engineers; they did it by refusing to let upstream vendor changes dictate their operational tempo.

Network flow data is one of the most underutilized sources of telemetry in enterprise security.

Not because it lacks value. NetFlow, sFlow, and IPFix reveal traffic patterns, lateral movement, and network behavior that firewalls, EDR, and cloud security tools simply cannot see. Flow data fills visibility gaps across hybrid networks, especially in regions where deploying traditional security tooling is impractical or impossible.

Teams know this. They understand flow data matters.

The problem is that getting flow data into a SIEM is unnecessarily complex. SIEM vendors don't support flow protocols natively. Teams are left building conversion pipelines, deploying NetFlow collectors, configuring stream forwarders, and wrestling with high-volume ingestion costs. The infrastructure required to make flow data useful often makes it not worth the effort.

So flow data gets deprioritized. The visibility gaps remain.

The Current Reality: Three Bad Options

When it comes to flow data ingestion, most security teams end up choosing between approaches that all have significant downsides:

Option 1: Build conversion layers: Deploy NetFlow collectors, configure forwarders, convert flow records to syslog or HTTP formats that SIEMs can ingest. This approach works, but it's brittle. Conversion pipelines break when devices get upgraded, when flow templates change, when new versions of NetFlow or IPFix are introduced. Each failure creates a blind spot until someone notices and fixes it.

Option 2: Send raw flow data directly to the SIEM: Skip the intermediary layers and point flow exporters straight at the SIEM. The problem? Flow data is high-volume and noisy. Without intelligent filtering and aggregation, raw flow records flood SIEMs with redundant, low-value events. Ingestion costs explode. SIEM performance degrades. Teams end up paying for noise.

Option 3: Skip flow data entirely: Accept the visibility gaps. Rely on what firewalls, endpoints, and cloud logs can show. Hope that lateral movement, data exfiltration, and shadow IT don't happen in the parts of the network you can't see.

None of these options are good. But for most teams, one of these three is reality. The root cause? SIEM vendors have historically treated flow data as an edge case. Most platforms don't support flow protocols natively.

This is where Databahn comes in.

Databahn's Flow Collector: Direct Ingestion, Zero Middleware

Databahn's Flow Collector was built to eliminate the unnecessary complexity of flow data ingestion. Instead of forcing flow records through conversion pipelines or accepting the cost explosion of raw SIEM ingestion, the Flow Collector receives NetFlow, sFlow, and IPFix directly via UDP, normalizes the data to JSON, and applies intelligent filtering before it ever reaches the SIEM.

How It Works

The Flow Collector listens directly on the network for flow records sent over UDP. Point your flow exporters—routers, switches, firewalls—at Databahn's Smart Edge Collector. Configure the source using pre-defined templates for collection, normalization, filtering, and transformation. That's it.

Behind the scenes, the platform handles the complexity:

  • Protocol support across versions: NetFlow (v5, v7, v9), sFlow, IPFix — every major flow protocol and version are supported natively. No custom parsers. No version-specific workarounds.
  • Automatic normalization: Flow records arrive in different formats with varying field structures. The Flow Collector converts them to a consistent JSON format, making downstream processing straightforward.
  • Intelligent volume control: Flow data is noisy. Duplicate records, low-priority flows, redundant session updates, all of this inflates ingestion cost without delivering insight. Databahn filters, aggregates, and deduplicates flow data before it reaches the SIEM, ensuring only relevant, curated events are ingested.
What This Means

Before: Multi-hop architecture. Brittle conversion layers. High-volume SIEM ingestion. Cost explosions. Visibility gaps accepted as inevitable.

After: Direct ingestion. Automatic normalization. Intelligent filtering at the edge. Complete network visibility without operational complexity or runaway costs.

Flow data becomes what it should have been from the start: straightforward, cost-controlled, and foundational to how you see your network.

No More Trade-Offs

Flow data has always been valuable. What’s changed is that collecting it no longer requires accepting operational complexity or budget explosions.

Databahn’s Flow Collector removes those trade-offs. Flow data stops being the thing security teams know they should collect but can’t justify the effort. It becomes what it should have been from the start: straightforward, cost-controlled, and foundational to how you see your network.

The visibility gaps in your network aren’t inevitable. The infrastructure just needed to catch up.

Databahn’s Flow Collector is available as part of the Databahn platform. Want to see how it handles your network architecture? Request a demo or talk to our team about your flow data challenges.

For years, enterprises have been told a comforting story: telemetry is telemetry. Logs are logs. If you can collect, normalize, and route data efficiently, you can support both observability and security from the same pipeline.

At first glance, this sounds efficient. One ingestion layer. One set of collectors. One routing engine. Lower cost. Cleaner architecture. But this story hides a fundamental mistake.

Observability, telemetry, and security telemetry are not simply two consumers of the same data stream. They are different classes of data with distinctintents, time horizons, economic models, and failure consequences.

The issue is intent. This is what we at Databahn call the Telemetry Intent Gap: the structural difference between operational telemetry and adversarial telemetry. Ignoring this gap is quietly eroding security outcomes across modern enterprises.

The Convenient Comfort of ‘One Pipeline’

The push to unify observability and security pipelines didn’t stem from ignorance. It stemmed from pressure. Exploding data volumes and rising SIEM costs which outstrip CISO budgets and their data volumes are exploding. Costs are rising. Security teams are overwhelmed. Platform teams are tired of maintaining duplicate ingestion layers. Enterprises want simplification.

At the same time, a new class of vendors has emerged,positioning themselves between observability and security. They promise a shared telemetry plane, reduced ingestion costs, and AI-powered relevance scoring to “eliminate noise.” They suggest that intelligent pattern detection can determine which data matters for security and keep the rest out ofSIEM/SOAR threat detection and security analytics flows.

On paper, this sounds like progress. In practice, it risks distorting security telemetry into something it was never meant to be.

Observability reflects operational truths, not security relevance

From an observability perspective, telemetry exists to answer a narrow but critical question: Is the system healthy right now? Metrics, traces, and debug logs are designed to detect trends, analyze latency, measure error rates, and identify performance degradation. Their value is statistical. They are optimized for aggregation, sampling, and compression. If a metric spike is investigated and resolved, the granular trace data may never be needed again. If a debug logline is redundant, suppressing it tomorrow rarely creates risk. Observability data is meant to be ephemeral by design: its utility decays quickly, and its value lies in comparing the ‘right now’ status to baselines or aggregations to evaluate current operational efficiency. 

This makes it perfectly rational to optimize observability pipelines for:

·      Volume reduction

·      Sampling

·      Pattern compression

·      Short- to medium-term retention

The economic goal is efficiency. The architectural goal isspeed. The operational goal is performance stability. Now contrast that with security telemetry.

Security telemetry is meant for adversarial truth

Security telemetry exists to answer a very different question: Did something malicious happen – even if we don't yet know what or who it is?

Security telemetry is essential. Its value is not statistical but contextual. An authentication event that appears benign today may become critical evidence two years later during an insider threat investigation. A low-frequency privilege escalation may seem irrelevant until it becomes part of a multi-stage attack chain. A lateral movement sequence may span weeks across multiple systems before becoming visible. Unlike observability telemetry, security telemetry is often valuable precisely because it resists pattern compression.

Attack behavior does not always conform to short-term statistical anomalies. Adversaries deliberately operate below detection thresholds. They mimic normal behavior. They stretch activity over long time horizons. They exploit the fact that most systems optimize for recent relevance. Security relevance is frequently retrospective, and this is where the telemetry intent gap becomes dangerous.

The Telemetry Intent Gap

This gap is not about format or data movement. It is about the underlying purpose of two different types of data. Observability pipelines are meant to uncover and track performance truth, while security pipelines are meant to uncover adversarial truth.

Observability asks: Is this behavior normal? Is the data statistically consistent? Security asks: Does the data indicate malicious intent? In observability, techniques such as sampling and compression to aggregate and govern data make sense. In security, all potential evidence and information should be maintained and accessible, and kept in a structured, verifiable manner. Essentially, how you treat – and, at a design level, what you optimize for – in your pipeline strongly impacts outcomes. When telemetry types are processed through the same optimization strategy, one of them loses. And in most enterprises, the cost of retaining and managing all data puts the organization's security posture at risk.

The Rise of AI-powered ‘relevance’

In response to cost pressure, a growing number of vendors catering to observability and security telemetry use cases claim to solve this problem with AI-driven relevance scoring. Their premise is simple: use pattern detection to determine which logs matter, and drop/reroute the rest. If certain events have not historically triggered investigations or alerts, they are deemed low-value and suppressed upstream.

This approach mirrors observability logic. It assumes that medium-term patterns define value. It assumes that the absence of recent investigations or alerts implies no or low risk. For observability telemetry, this may be acceptable.

For security telemetry, this is structurally flawed. Security detection itself is pattern recognition – but of a much deeper kind. It involves understanding adversarial tradecraft, long-term behavioral baselines and rare signal combination that may never have appeared before. Many sophisticated attacks accrue slowly, and involve malicious action with low-and-slow privilege escalation, compromised dormant credentials, supply chain manipulation, and cloud misconfiguration abuse. These behaviors do not always trigger immediate alerts. They often remain dormant until correlated with events months or years later.

An observability-first AI model trained on short-term usage patterns may conclude that such telemetry is "noise". It may reduce ingestion based on absence of recent alerts. It may compress away low-frequency signals. But absence of investigations is not the absence of threats. Security relevance is often invisible until context accumulates. The timeline over which security data would find relevance is not predictable, and making short and medium-term judgements on the relevance of security data is a detriment to long-horizon detection and forensic reconstruction.

When Unified Pipelines Quietly Break Security

The damage does not announce itself loudly. It appears as:

·      Missing context during investigations

·      Incomplete event chains

·      Reduced ability to reconstruct attacker movement

·      Inconsistent enrichment across domains

·      Silent blind spots

Detection engineers often experience this in terms of fragility: rules are breaking, investigations are stalling, and data must be replayed from cold storage – if it exists. SOC teams lose confidence in their telemetry, and the effort to ensure telemetry 'completeness' or relevance becomes a balancing act between budget and security posture.

Meanwhile, platform teams believe the pipeline is functioning perfectly – it is running smoothly, operating efficiently, and cost-optimized. Both teams are correct, but they are optimizing for different outcomes. This is the Telemetry Intent Gap in action.

This is not a Data Collection issue

It is tempting to frame this as a tooling or ingestion issue. But this isn't about that. There is no inherent challenge in using the same collectors, transport protocols, or infrastructure backbone. What must differ is the pipeline strategy. Security telemetry requires:

·      Early context preservation

·      Relevance decisions informed by adversarial models, not usage frequency

·      Asymmetric retention policies

·      Separation of security-relevant signals from operational exhaust

·      Long-term evidentiary assumptions

Observability pipelines are not wrong. They are simply optimized for a different purpose. The mistake is in believing that the optimization logic is interchangeable.

The Business Consequence

When enterprises blur the line between observability and security telemetry, they are not just risking noisy dashboards. They are risking investigative integrity. Security telemetry underpins compliance reporting, breach investigations, regulatory audits, and incident reconstruction. It determines whether an enterprise can prove what happened – and when.

Treating it as compressible exhaust because it did not trigger recent alerts is a dangerous and risky decision. AI-powered insights without security context will often over index on short and medium term usage patterns, leading to a situation where the mechanics and costs of data collection obfuscate a fundamental difference in business value.

Operational telemetry supports system reliability. Security telemetry supports enterprise resilience. These are not equivalent mandates, and treating them similarly leads to compromises on security posture that are not tenable for enterprise stacks.

Towards intent-aware pipelines

The answer is not duplicating infrastructure. It is designing pipelines that understand intent. An intent-aware strategy acknowledges:

·      Some data is optimized for performance efficiency

·      Some data is optimized for adversarial accountability

·      The same transport can support both, but the optimization logic – and the ability to segment and contextually treat and distinguish this data – is critical

This is where purpose-built security data platforms are emerging – not as generic routers, and not as observability engines extended into security, but as infrastructure optimized for adversarial telemetry from the start.

Platforms designed with security intent as their core – and not observability platforms extending into the security 'use case – do not define the value of data by their recent pattern frequency alone. They are opinionated, have a contextual understanding of security relevance, and are able to preserve and even enrich and connect data to enable long-term reconstruction. They treat telemetry as evidence, not exhaust.

That architectural stance is not a feature. It is a philosophy. And it is increasingly necessary.

Observability and Security can share pipes – not strategy

The enterprise temptation to unify telemetry is understandable. The cost pressures are real. The operational fatigue is real. But conflating optimization logic across observability and security is not simplification. It is misalignment. The future of enterprise telemetry is not a single, flattened data stream scored by generic AI relevance. It is a layered architecture that respects the Telemetry Intent Gap.

The difference between operational optimization and adversarial investigation can coexist and share infrastructure, but they cannot share strategy. Recognizing this difference may be one of the most important architectural decisions security and platform leaders make in the coming decade.

Subscribe to DataBahn blog!

Get expert updates on AI-powered data management, security, and automation—straight to your inbox

Access the Full Content

Enter your details to continue.

Access the Full Content

Enter your details to continue.

Access the Full Content

Enter your details to continue.

Access the Full Content

Enter your details to continue.