Custom Styles

Sentinel best practices: How SOCs can optimize Sentinel costs & performance

How enterprise SOCs can get the most value out of their Sentinel deployment with DOTDNA's AIDF framework and DataBahn

March 27, 2025
|

Microsoft Sentinel best practices

How SOCs can optimize Sentinel costs & performance

Enterprises and security teams are increasingly opting for Microsoft Sentinel for its comprehensive service stack, advanced threat intelligence, and automation capabilities, which facilitate faster investigations.

However, security teams are often caught off guard by the rapid escalation of data ingestion costs with Sentinel. As organizations scale their usage of Sentinel, the volume of data they ingest increases exponentially. This surge in data volume results in higher licensing costs, adding to the financial burden for enterprises. Beyond the cost implications, this data overload complicates threat identification and response, often resulting in delayed detections or missed signals entirely. Security teams find themselves constantly struggling to filter noise, manage alert volumes, and maintain operational efficiency while working to extract meaningful insights from overwhelming data streams.

The Data Overload Problem for Microsoft Sentinel

One of Sentinel's biggest strengths is its ease of integrating Microsoft data sources. SIEM operators can connect Azure, Office, and other Microsoft sources to Sentinel with ease. However, the challenge emerges when integrating non-Microsoft sources, which requires creating custom integrations and managing data pipelines.

For Sentinel to provide comprehensive security coverage and effective threat detection, all relevant security data must be routed through the platform. This requires connecting various security data sources such as firewalls, EDR/XDR, and even business applications to Sentinel, resulting in a 4 to 8 week data engineering effort that SOCs have to absorb.

On the other hand, enterprises often stop sending firewall logs to Sentinel due to the increasing log volume and costs associated with unexpected data volume spikes, which also lead to frequent breaks and issues in the data pipelines.

Then vs. Now: Key to Faster Threat Detection

Traditional data classification methods struggle to keep pace with modern security challenges. Security teams often rely on predefined rules or manual processes to categorize and prioritize data. As volumes expand exponentially, these teams find themselves ill-equipped to handle large data ingestions, resulting in critical losses of real-time insights!

DataBahn aids Sentinel deployments by streamlining data collection and ingestion with over 400 plug-and-play connectors. The platform intelligently defines data routing between basic and analytics tables while deploying strategic staging locations to efficiently publish data from third-party products into your Sentinel environment. With DataBahn’s volume reduction functions like aggregation and suppression to convert noisy logs like network traffic into manageable insights that can be loaded into Sentinel, effectively reducing both data volume and the overall time for query execution.

DOTDNA's AIDF Framework

DOTDNA has developed and promotes the Actionable Data Ingestion Framework (ADIF), designed to separate signal from noise by sorting your log data into two camps: critical, high-priority logs that are sent to Security Information and Event Management (SIEM) for real-time analysis and non-critical background data that can be stored long-term in cost-effectively storage.

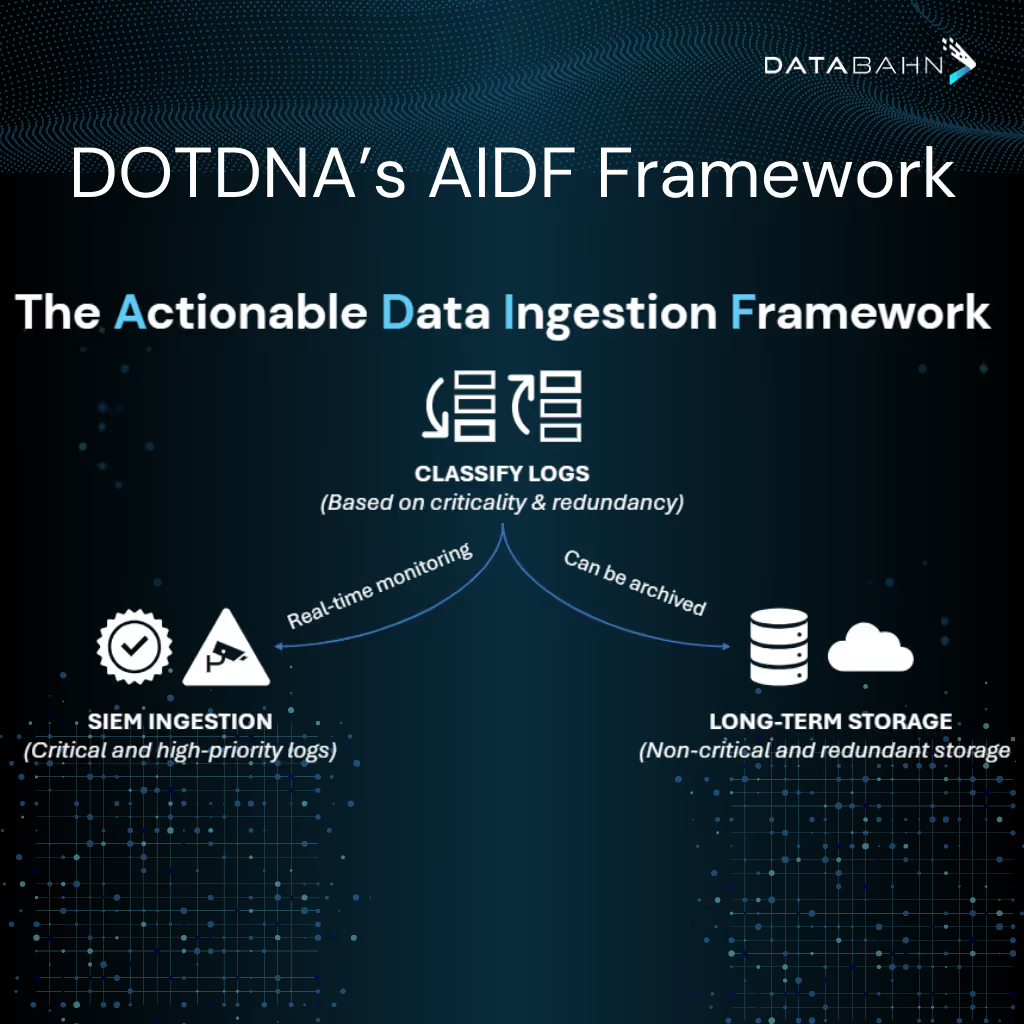
The framework streamlines log ingestion processes, prioritizes truly critical security events, eliminates redundancy, and precisely aligns with your specific security use cases. This targeted approach ensures your CyberOps team remains focused on high-priority, actionable data, enabling enhanced threat detection and more efficient response. The result is improved operational efficiency and significant cost savings. The framework guarantees that only actionable information is processed, facilitating faster investigations and better resource allocation.

The Real Impact

Following an acquisition, a UK-based enterprise needed to consolidate multiple SIEM and SOC providers into a single Sentinel instance while effectively managing data volumes and license costs. DOTDNA implemented DataBahn's Data Fabric to architect a solution that intelligently filters, optimizes, and dynamically tags and routes only security-relevant data to Sentinel, enabling the enterprise to substantially reduce its ingestion and data storage costs.

Optimizing Log Implementation via DOTDNA: Through the strategic implementation of this architecture, DOTDNA created a targeted solution that prioritizes genuine security signals before routing to Sentinel. This precision approach reduced the firm's ingestion and data storage costs by $230,000 annually while maintaining comprehensive security visibility across all systems.

Reduced Sentinel Ingestion Costs via DataBahn’s Data Fabric: The DataBahn Data Fabric Solution precisely orchestrates data flows, extracting meaningful security insights and delivering only relevant information to your Sentinel SIEM. This strategic filtering achieves a significant reduction in data volume without compromising security visibility, maximizing both your security posture and ROI.

Conclusion

As data volumes exponentially grow, DataBahn's Data Fabric empowers security teams to shift from reactive firefighting to proactive threat hunting. Without a modern data classification framework like ADIF, security teams risk feeling overwhelmed by irrelevant data, potentially leading to missed threats and delayed responses. Take control of your security data today with a strategic approach that prioritizes actionable intelligence. By implementing a solution that delivers only the most relevant data to your security tools, transform your security operations from data overload to precision threat detection—because effective security isn't about more data, it's about the right data.

This post is based on a conversation between Davide, Founder of DOTDNA with Databahn's CPO, Aditya Sundararam. You can view this conversation on LinkedIn here.

Ready to unlock full potential of your data?
Share

See related articles

For most CIOs and SRE leaders, observability has grown into one of the most strategic layers of the technology stack. Cloud-native architectures depend on it, distributed systems demand it, and modern performance engineering is impossible without it. And yet, even as enterprises invest heavily in their platforms, pipelines, dashboards, and agents, the experience of achieving true observability feels harder than it should be.

Telemetry and observability systems have become harder to track and manage than ever before. Data flows, sources, and volumes shift and scale unpredictably. Different cloud containers and applications straddle different regions and systems, introducing new layers of complexity and chaos that enterprises never built these systems for.

In this environment, the traditional assumptions underpinning observability begin to break down. The tools are more capable than ever, but the architecture that feeds them has not kept pace. The result is a widening gap between what organizations expect observability to deliver and what their systems are actually capable of supporting.

Observability is no longer a tooling problem. It is a challenge to create future-forward infrastructure for observability.

The New Observability Mandate

The expectations for observability systems today are much higher than when those systems were first created. Modern organizations require observability solutions that are fast, adaptable, consistent across different environments, and increasingly enhanced by machine learning and automation. This change is not optional; it is the natural result of how software has developed.

Distributed systems produce distributed telemetry. Every service, node, pod, function, and proxy contributes its own signals: traces, logs, metrics, events, and metadata form overlapping but incomplete views of the truth. Observability platforms strive to provide teams with a unified view, but they often inherit data that is inconsistent or poorly structured. The responsibility to interpret the data shifts downstream, and the platform becomes the place where confusion builds up.

Meanwhile, telemetry volume is increasing rapidly. Most organizations collect data much faster than they can analyze it. Costs rise with data ingestion and storage, not with gaining insights. Usually, only a small part of the collected telemetry is used for investigations or analytics, even though teams feel the need to keep collecting it. What was meant to improve visibility now overwhelms the very clarity it aimed to provide.

Finally, observability must advance from basic instrumentation to something smarter. Modern systems are too complex for human operators to interpret manually. Teams need observability that helps answer not just “what happened,” but “why it happened” and “what matters right now.” That transition requires a deeper understanding of telemetry at the data level, not just more dashboards or alerts.

These pressures lead to a clear conclusion. Observability requires a new architectural foundation that considers data as the primary product, not just a byproduct.

Why Observability Architectures are Cracking

When you step back and examine how observability stacks developed, a clear pattern emerges. Most organizations did not intentionally design observability systems; they built them up over time. Different teams adopted tools for tracing, metrics, logging, and infrastructure monitoring. Gradually, these tools were linked together through pipelines, collectors, sidecars, and exporters. However, the architectural principles guiding these integrations often received less attention than the tools themselves.

This piecemeal evolution leads to fragmentation. Each tool has its own schema, enrichment model, and assumptions about what “normal” looks like. Logs tell one story, metrics tell another, and traces tell a third. Combining these views requires deep expertise and significant operational effort. In practice, the more tools an organization adds, the harder it becomes to maintain a clear picture of the system.

Silos are a natural result of this fragmentation, leading to many downstream issues. Visibility becomes inconsistent across teams, investigations slow down, and it becomes harder to identify, track, and understand correlations across different data types. Data engineers must manually translate and piece together telemetry contexts to gain deeper insights, which creates technical debt and causes friction for the modern enterprise observability team.

Cost becomes the next challenge. Telemetry volume increases predictably in cloud-native environments. Scaling generates more signals. More signals lead to increased data ingestion. Higher data ingestion results in higher costs. Without a structured approach to parsing, normalizing, and filtering data early in its lifecycle, organizations end up paying for unnecessary data processing and can't make effective use of the data they collect.

Complexity adds another layer. Traditional ingest pipelines weren't built for constantly changing schemas, high-cardinality workloads, or flexible infrastructure. Collectors struggle during burst periods. Parsers fail when fields change. Dashboards become unreliable. Teams rush to fix telemetry before they can fix the systems the telemetry is meant to monitor.

Even the architecture itself works against teams. Observability stacks were initially built for stable environments. They assume predictable data formats, slow-moving schemas, and a manageable number of sources. Modern environments break each of these assumptions.

And beneath it all lies a deeper issue: telemetry is often gathered before it is fully understood. Downstream tools receive raw, inconsistent, and noisy data, and are expected to interpret it afterward. This leads to a growing insight gap. Organizations collect more information than ever, but insights do not keep up at the same rate.

The Architectural Root Cause

Observability systems were built around tools rather than a unified data model. The architecture expanded through incremental additions instead of being designed from first principles. The growing number of tools, along with the increased complexity and scale of telemetry, created systemic challenges. Engineers now spend more time tracking, maintaining, and repairing data pipelines than developing systems to enhance observability. The unexpected surge in complexity and volume overwhelmed existing systems, which had been improved gradually. Today, Data Engineers inherit legacy systems with fragmented and complex tools and pipelines, requiring more time to manage and maintain, leaving less time to improve observability and more on fixing it. 

A modern observability system must be designed to overcome these brittle foundations. To achieve adaptive, cost-efficient observability that supports AI-driven analysis, organizations need to treat telemetry as a structured, governed, high-integrity layer. Not as a byproduct that downstream tools must interpret and repair.

The Shift Upstream: Intelligence in the Pipeline

Observability needs to begin earlier in the data lifecycle. Instead of pushing raw telemetry downstream, teams should reshape, enrich, normalize, and optimize data while it is still in motion. This single shift resolves many of the systemic issues that plague observability systems today.  

AI-powered parsing and normalization ensure telemetry is consistent before reaching a tool. Automated mapping reduces the operational effort of maintaining thousands of fields across numerous sources. If schemas change, AI detects the update and adjusts accordingly. What used to cause issues becomes something AI can automatically resolve.

The analogy is straightforward: tracking, counting, analyzing, and understanding data in pipelines while it is streaming is easier than doing so when it is stationary. Volumes and patterns can be identified and monitored more effortlessly within the pipeline itself as the data enters the system, providing the data stack with a better opportunity to comprehend them and direct them to the appropriate destination. 

Data engineering automation enhances stability. Instead of manually built transformations that fail silently or decline in quality over time, the pipeline becomes flexible. It can adapt to new event types, formats, and service boundaries. The platform grows with the environment rather than being disrupted by it.

Upstream visibility adds an extra layer of resilience. Observability should reveal not only how the system behaves but also the health of the telemetry that describes it. If collectors fail, sources become noisy, fields drift, or events spike unexpectedly, teams need to know at the source. Troubleshooting starts before downstream tools are impacted.

Intelligent data tiering is only possible when data is understood early. Not every signal warrants the same storage cost or retention period. By assessing data based on relevance rather than just time, organizations can significantly reduce costs while maintaining high-signal visibility.

All of this contributes to a fundamentally different view of observability. It is no longer something that happens in dashboards. It occurs in the pipeline.

By managing telemetry as a governed, intelligent foundation, organizations achieve clearer visibility, enhanced control, and a stronger base for AI-driven operations.

How Databahn Supports this Architectural Future

In the context of these structural issues shaping the future of observability, it is essential to note that AI-powered pipelines can be the right platform for enterprises to build this next-generation foundation – today, and not as part of an aspirational future.

Databahn provides the upstream intelligence described above by offering AI-powered parsing, normalization, and enrichment that prepare telemetry before it reaches downstream systems. The platform automates data engineering workflows, adjusts to schema drift, offers detailed visibility into source telemetry, and supports intelligent data tiering based on value, not volume. The result is an AI-ready telemetry fabric that enhances the entire observability stack, regardless of the tools an organization uses.

Instead of adding yet another system to an already crowded ecosystem, Databahn helps organizations modernize the architecture layer underneath their existing tools. This results in a more cohesive, resilient, and cost-effective observability foundation.

The Path Forward: AI-Ready Telemetry Infrastructure

The future of observability won't be shaped by more dashboards or agents. Instead, it depends on whether organizations can create a stable, adaptable, and intelligent foundation beneath their tools.

That foundation starts with telemetry. It needs structure, consistency, relevance, and context. It demands automation that adapts as systems change. It also requires data that is prepared for AI reasoning.

Observability should move from being tool-focused to data-focused. Only then can teams gain the clarity, predictability, and intelligence needed in modern, distributed environments.

This architectural shift isn't a future goal; it's already happening. Teams that adopt it will have a clear edge in cost, resilience, and speed.  

Every industry goes through moments of clarity, moments when someone steps back far enough to see not just the technologies taking shape, but the forces shaping them. The Software Analyst Cybersecurity Research (SACR) team’s latest report on Security Data Pipeline Platforms (SDPP) is one of those moments. It is rare for research to capture both the energy and the tension inside a rapidly evolving space, and to do so with enough depth that vendors, customers, and analysts all feel seen. Their work does precisely that.

Themes from the Report

Several themes stood out to us at Databahn because they reflect what we hear from customers every day. One of those themes is the growing role of AI in security operations. SACR is correct in noting that AI is no longer just an accessory. It is becoming essential to how analysts triage, how detections are created, and how enterprises assess risk. For AI to work effectively, it needs consistent, governed, high-quality data, and the pipeline is the only place where that foundation can be maintained.

Another theme is the importance of visibility and monitoring throughout the pipeline. As telemetry expands across cloud, identity, OT, applications, and infrastructure, the pipeline has become a dynamic system rather than just a simple conduit. SOC teams can no longer afford blind spots in how their data flows, what is breaking upstream, or how schema changes ripple downstream. SACR’s recognition of this shift reflects what we have observed in many large-scale deployments.

Resilience is also a key theme in the report. Modern security architecture is multi-cloud, multi-SIEM, multi-lake, and multi-tool. It is distributed, dynamic, and often unpredictable. Pipelines that cannot handle drift, bursts, outages, or upstream failures simply cannot serve the SOC. Infrastructure must be able to gracefully degrade and reliably recover. This is not just a feature; it is an expectation.

Finally, SACR recognizes something that is becoming harder for vendors to admit: the importance of vendor neutrality. Neutrality is more than just an architectural choice; it’s the foundation that enables enterprises to choose the right SIEM for their needs, the right lake for their scale, the right detection strategy for their teams, and the right AI platforms for their maturity. A control plane that isn’t neutral eventually becomes a bottleneck. SACR’s acknowledgment of this risk demonstrates both insight and courage.

The future of the SOC has room for AI, requires deep visibility, depends on resilience, and can only remain healthy if neutrality is preserved. Another trend that SACR’s report tracked was the addition of adjacent functions, bucketed as ‘SDP Plus’, which covered a variety of features – adding storage options, driving some detections in the pipeline directly, and observability, among others. The report has cited Databahn for their ‘pipeline-centric’ strategy and our neutral positioning.  

As the report captures what the market is doing, it invites each of us to think more deeply about why the market is doing it and whether that direction serves the long-term interests of the SOC.

The SDP Plus Drift

Pipelines that started with clear purpose have expanded outward. They added storage. They added lightweight detection. They added analytics. They built dashboards. They released thin AI layers that sat beside, rather than inside, the data. In most cases, these were not responses to customer requests. They were responses to a deeper tension, which is that pipelines, by their nature, are quiet. A well-built pipeline disappears into the background. When a category is young, vendors fear that silence. They fear being misunderstood. And so they begin to decorate the pipeline with features to make it feel more visible, more marketable, more platform-like.

It is easy to understand why this happens. It is also easy to see why it is a problem.

A data pipeline has one essential purpose. It moves and transforms data so that every system around it becomes better. That is the backbone of its value. When a pipeline begins offering storage, it creates a new gravity center inside the enterprise. When it begins offering detection, it creates a new rule engine that the SOC must tune and maintain. When it adds analytics, it introduces a new interpretation layer that can conflict with existing sources of truth. None of these actions are neutral. Each shifts the role of the pipeline from connector to competitor.

This shift matters because it undermines the very trust that pipelines rely on. It is similar to choosing a surgeon. You choose them for their precision, their judgment, their mastery of a single craft. If they try to win you over by offering chocolates after the surgery, you might appreciate the gesture, but you will also question the focus. Not because chocolates are bad, but because that is not why you walked into the operating room.  

Pipelines must not become distracted. Their value comes from the depth of their craft, not the breadth of their menu. This is why it is helpful to think about security data pipelines as infrastructure. Infrastructure succeeds when it operates with clarity. Kubernetes did not attempt to become an observability tool. Snowflake did not attempt to become a CRM. Okta did not attempt to become a SIEM. What made them foundational was their refusal to drift. They became exceptional by narrowing their scope, not widening it. Infrastructure is at its strongest when it is uncompromising in its purpose.

Security data pipelines require the same discipline. They are not just tools; they are the foundation. They are not designed to interpret data; they are meant to enhance the systems that do. They are not intended to detect threats; they are meant to ensure those threats can be identified downstream with accuracy. They do not own the data; they are responsible for safeguarding, normalizing, enriching, and delivering that data with integrity, consistency, and trust.

The Value of SDPP Neutrality

Neutrality becomes essential in this situation. A pipeline that starts to shift toward analytics, storage, or detection will eventually face a choice between what's best for the customer and what's best for its own growing platform. This isn't just a theoretical issue; it's a natural outcome of economic forces. Once you sell a storage layer, you're motivated to route more data into it. Once you sell a detection layer, you're motivated to optimize the pipeline to support your detections. Neutrality doesn't vanish with a single decision; it gradually erodes through small compromises.

At Databahn, neutrality isn't optional; it's the core of our architecture. We don’t compete with the SIEM, data lake, detection systems, or analytics platforms. Instead, our role is to support them. Our goal is to provide every downstream system with the cleanest, most consistent, most reliable, and most AI-ready data possible. Our guiding principle has always been straightforward: if we are infrastructure, then we owe our customers our best effort, not our broadest offerings.

This is why we built Cruz as an agentic AI within the pipeline, because AI that understands lineage, context, and schema drift is far more powerful than AI that sits on top of inconsistent data. This is why we built Reef as an insight layer, not as an analytics engine, because the value lies in illuminating the data, not in competing with the tools that interpret it. Every decision has stemmed from a belief that infrastructure should deepen, not widen, its expertise.

We are entering an era in cybersecurity where clarity matters more than ever. AI is accelerating the complexity of the SOC. Enterprises are capturing more telemetry than at any point in history. The risk landscape is shifting constantly. In moments like these, it is tempting to expand in every direction at once. But the future will not be built by those who try to be everything. It will be built by those who know exactly what they are, and who focus their energy on becoming exceptional at that role.

Closing thoughts

The SACR report highlights how far the category has advanced. I hope it also serves as a reminder of what still needs attention. If pipelines are the control plane of the SOC, then they must stay pure. If they are infrastructure, they must be built with discipline. If they are neutral, they must remain so. And if they are as vital to the future of AI-driven security as we believe, they must form the foundation, not just be a feature.

At Databahn, we believe the most effective pipeline stays true to its purpose. It is intelligent, reliable, neutral, and deeply focused. It does not compete with surrounding systems but elevates them. It remains committed to its craft and doubles down on it. By building with this focus, the future SOC will finally have an infrastructure layer worthy of the intelligence it supports.

Picture this: it’s a sold-out Saturday. The mobile app is pushing seat upgrades, concessions are running tap-to-pay, and the venue’s “smart” cameras are adjusting staffing in real time. Then, within minutes, queues freeze. Kiosks time out. Fans can’t load tickets. A firmware change on a handful of access points creates packet loss that never gets flagged because telemetry from edge devices isn’t normalized or prioritized. The network team is staring at graphs, the app team is chasing a “payments API” ghost, and operations is on a walkie-talkie trying to reroute lines like it’s 1999.

Nothing actually “broke” – but the system behaved like it did. The signal existed in the data, just not in one coherent place, at the right time, in a format anyone could trust.

That’s where the state of observability really is today: tons of data, not enough clarity – especially close to the source, where small anomalies compound into big customer moments.

Why this is getting harder, not easier

Every enterprise now runs on an expanding mix of cloud services, third-party APIs, and edge devices. Tooling has sprawled for good reasons – teams solve local problems fast – but the sprawl works against global understanding. Nearly half of organizations still juggle five or more tools for observability, and four in ten plan to consolidate because the cost of stitching signals after the fact is simply too high.

More sobering: high-impact outages remain expensive and frequent. A majority report that these incidents cost $1M+ per hour; median annual downtime still sits at roughly three days; and engineers burn about a third of their week on disruptions. None of these are “tool problems” – they’re integration, governance, and focus problems. The data is there. It just isn’t aligned.

What good looks like; and why we aren’t there yet

The pattern is consistent: teams that unify telemetry and move toward full-stack observability outperform. They see radically less downtime, lower hourly outage costs, and faster mean-time-to-detect/resolve (MTTD/MTTR). In fact, organizations with full-stack observability experience roughly 79% less downtime per year than those without – an enormous swing that shows what’s possible when data isn’t trapped in silos.

But if the winning patterns is so clear, why aren’t more teams there already?

Three reasons keep coming up in practitioner and leadership conversations:

  1. Heterogeneous sources, shifting formats. New sensors, services, and platforms arrive with their own schemas, naming, and semantics. Without upstream normalization, every dashboard and alert “speaks a slightly different dialect.” Governance becomes wishful thinking.
  1. Point fixes vs. systemic upgrades. It’s hard to lift governance out of individual tools when the daily firehose keeps you reactive. You get localized wins, but the overall signal quality doesn’t climb.
  1. Manual glue. Humans are still doing context assembly – joining business data with MELT, correlating across tools, re-authoring similar rules per system. That’s slow and brittle.

Zooming out: what the data actually says

Let’s connect the dots in plain English:

  • Tool sprawl is real. 45% of orgs use five or more observability tools. Most use multiple, and only a small minority use one. It’s trending down, and 41% plan to consolidate – but today’s reality remains multi-tool.
  • Unified telemetry pays off. Teams with more unified data experience ~78% less downtime vs. those with siloed data. Said another way: the act of getting logs, metrics, traces, and events into a consistent, shared view delivers real business outcomes.
  • The value is undeniable. Median annual downtime across impact levels clocks in at ~77 hours; for high-impact incidents, 62% say the hourly cost is at least $1M. When teams reach full-stack observability, hourly outage costs drop by nearly half.
  • We’re still spending time on toil. Engineers report around 30% of their time spent addressing disruptions. That’s innovation time sacrificed to “finding and fixing” instead of “learning and improving.”
  • Leaders want governance, not chaos. There’s a clear preference for platforms that are more capable at correlating telemetry with business outcomes and generating visibility without spiking manual effort and management costs.

The edge is where observability’s future lies

Back to our almost-dark stadium. The fix isn’t “another dashboard.” It’s moving control closer to where telemetry is born and ensuring the data becomes coherent as it moves, not after it lands.

That looks like:

  • Upstream normalization and policy: standardizing fields, units, PII handling, and tenancy before data fans out to tools.
  • Schema evolution without drama: recognizing new formats at collection time, mapping them to shared models, and automatically versioning changes.
  • Context attached early: enriching events with asset identity, environment, service boundaries, and – crucially – business context (what this affects, who owns it, what “good” looks like), so investigators don’t have to hunt for meaning later.
  • Fan-out by design, not duplication: once the signal is clean, you can deliver the same truth to APM, logs, security analytics, and data lakes without re-authoring rules per tool.

When teams do this, the graphs start agreeing with each other. And when the graphs agree, decisions accelerate. Every upstream improvement makes all of your downstream tools and workflows smarter. Compliance is easier and more governed; data is better structured; its routing is more streamlined. Audits are easier and are much less likely to surface annoying meta-needs but are more likely to generate real business value.

The AI inflection: less stitching, more steering

The best news? We finally have the toolsto automate the boring parts and amplify the smart parts.

  • AIOps that isn’t just noise. With cleaner, standardized inputs, AI has less “garbage” to learn from and can detect meaningful patterns (e.g., “this exact firmware + crowd density + POS jitter has preceded incidents five times in twelve months”).
  • Agentic workflows. Instead of static playbooks, agentic AI can learn and adapt: validate payloads, suggest missing context, test routing changes, or automatically revert a bad config on a subset of edge devices – then explain what it did in human terms.
  • Human-in-the-loop escalation. Operators set guardrails; AI proposes actions, runs safe-to-fail experiments, and asks for approval on higher-risk steps. Over time, the playbook improves itself.

This isn’t sci-fi. In the same industry dataset, organizations leaning into AI monitoring and related capabilities report higher overall value from their observability investments – and leaders list adoption of AI tech as a top driver for modernizing observability itself.

Leaders are moving – are you?

Many of our customers are finding our AI-powered pipelines – with agentic governance at the edge through the data path – as the most reliable way to harness the edge-first future of observability. They’re not replacing every tool; they’re elevating the control plane over the tools so that managing what data gets to each tool is optimized for cost, quality, and usefulness. This is the shift that is helping our Fortune 100 and Fortune 500 customers convert flight data, OT telemetry, and annoying logs into their data crown jewels.

If you want the full framework and the eight principles we use when designing modern observability, grab the whitepaper, Principles of Intelligent Observability, and share it with your team. If you’d like to explore how AI-powered pipelines can make this real in your environment, request a demo and learn more about how our existing customers are using our platform to solve security and observability challenges while accelerating their transition into AI.

Subscribe to DataBahn blog!

Get expert updates on AI-powered data management, security, and automation—straight to your inbox

Hi 👋 Let’s schedule your demo

Thank you! Your submission has been received!
Oops! Something went wrong while submitting the form.

Trusted by leading brands and partners

optiv
mobia
la esfera
inspira
evanssion
KPMG
Guidepoint Security
EY
ESI